NCERT Solutions for Class 11 Maths Chapter 13 Statistics
Statistics Class 11 NCERT Solutions for Maths
NCERT Solutions for Class 11 Maths Chapter 13 Statistics are provided here to ensure students get a helping hand for their practice and transform into a mathematical wizard. Statistics is a crucial segment of the mathematics syllabus and students must deal it with sincerity.
The NCERT Solutions for Statistics Class 11 are prepared by subject experts here at SimplyAcad for students to clear and strengthen their basics. These solutions are designed to boost the confidence of students struggling with Statistics, and prepare them for the upcoming battle. The provided answers of the Statistics Class 11 are tailored according to the latest syllabus of 2024-25.
SimplyAcad has provided the solutions of all the exercises of the Statistics Class 11 in an easy to understand and approachable manner. This will allow students to access the answers without much hassle. The provided answers will benefit students most through developing a regular habit of practice and revision.
NCERT Solutions for Class 11 Maths Chapter 13 Statistics Exercise 13.1 Statistics Class 11
Find the mean deviation about the mean for the data in Exercises 1 and 2.
1. 4, 7, 8, 9, 10, 12, 13, 17
Statistics Solution:-
First, we have to find (x̅) of the given data.
So, the respective values of the deviations from mean,
i.e., xi – x̅ are, 10 – 4 = 6, 10 – 7 = 3, 10 – 8 = 2, 10 – 9 = 1, 10 – 10 = 0,
10 – 12 = – 2, 10 – 13 = – 3, 10 – 17 = – 7
6, 3, 2, 1, 0, -2, -3, -7
Now, absolute values of the deviations,
6, 3, 2, 1, 0, 2, 3, 7
MD = sum of deviations/ number of observations
= 24/8
= 3
So, the mean deviation for the given data is 3.
2. 38, 70, 48, 40, 42, 55, 63, 46, 54, 44
Statistics Solution:-
First, we have to find (x̅) of the given data.
So, the respective values of the deviations from mean,
i.e., xi – x̅ are, 50 – 38 = -12, 50 -70 = -20, 50 – 48 = 2, 50 – 40 = 10, 50 – 42 = 8,
50 – 55 = – 5, 50 – 63 = – 13, 50 – 46 = 4, 50 – 54 = -4, 50 – 44 = 6
-12, 20, -2, -10, -8, 5, 13, -4, 4, -6
Now, absolute values of the deviations,
12, 20, 2, 10, 8, 5, 13, 4, 4, 6
MD = sum of deviations/ number of observations
= 84/10
= 8.4
So, the mean deviation for the given data is 8.4.
Find the mean deviation about the median for the data in Exercises 3 and 4.
3. 13, 17, 16, 14, 11, 13, 10, 16, 11, 18, 12, 17
Solution:-
First, we have to arrange the given observations into ascending order.
10, 11, 11, 12, 13, 13, 14, 16, 16, 17, 17, 18.
The number of observations is 12.
Then,
Median = ((12/2)th observation + ((12/2)+ 1)th observation)/2
(12/2)th observation = 6th = 13
(12/2)+ 1)th observation = 6 + 1
= 7th = 14
Median = (13 + 14)/2
= 27/2
= 13.5
So, the absolute values of the respective deviations from the median, i.e., |xi – M| are
3.5, 2.5, 2.5, 1.5, 0.5, 0.5, 0.5, 2.5, 2.5, 3.5, 3.5, 4.5
![]()
Mean Deviation
![]()
= (1/12) × 28
= 2.33
So, the mean deviation about the median for the given data is 2.33.
4. 36, 72, 46, 42, 60, 45, 53, 46, 51, 49
Solution:-
First, we have to arrange the given observations into ascending order.
36, 42, 45, 46, 46, 49, 51, 53, 60, 72.
The number of observations is 10.
Then,
Median = ((10/2)th observation + ((10/2)+ 1)th observation)/2
(10/2)th observation = 5th = 46
(10/2)+ 1)th observation = 5 + 1
= 6th = 49
Median = (46 + 49)/2
= 95
= 47.5
So, the absolute values of the respective deviations from the median, i.e., |xi – M| are
11.5, 5.5, 2.5, 1.5, 1.5, 1.5, 3.5, 5.5, 12.5, 24.5
Mean Deviation
![]()
= (1/10) × 70
= 7
So, the mean deviation about the median for the given data is 7.
Find the mean deviation about the mean for the data in Exercises 5 and 6.
5.
| xi | 5 | 10 | 15 | 20 | 25 |
| fi | 7 | 4 | 6 | 3 | 5 |
Solution:-
Let us make the table of the given data and append other columns after calculations.
| Xi | fi | fixi | |xi – x̅| | fi |xi – x̅| |
| 5 | 7 | 35 | 9 | 63 |
| 10 | 4 | 40 | 4 | 16 |
| 15 | 6 | 90 | 1 | 6 |
| 20 | 3 | 60 | 6 | 18 |
| 25 | 5 | 125 | 11 | 55 |
| 25 | 350 | 158 |
The sum of calculated data,
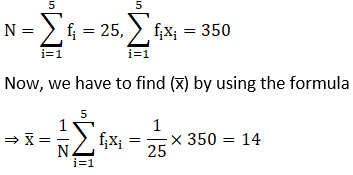
The absolute values of the deviations from the mean, i.e., |xi – x̅|, as shown in the table.

6.
| xi | 10 | 30 | 50 | 70 | 90 |
| fi | 4 | 24 | 28 | 16 | 8 |
Statistics Solution:-
Let us make the table of the given data and append other columns after calculations.
| Xi | fi | fixi | |xi – x̅| | fi |xi – x̅| |
| 10 | 4 | 40 | 40 | 160 |
| 30 | 24 | 720 | 20 | 480 |
| 50 | 28 | 1400 | 0 | 0 |
| 70 | 16 | 1120 | 20 | 320 |
| 90 | 8 | 720 | 40 | 320 |
| 80 | 4000 | 1280 |
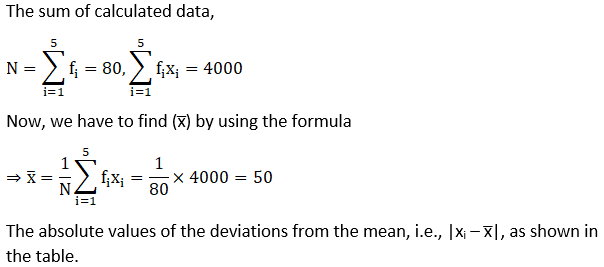
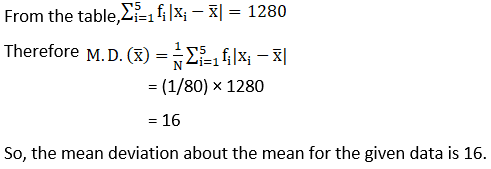
Find the mean deviation about the median for the data in Exercises 7 and 8.
7.
| xi | 5 | 7 | 9 | 10 | 12 | 15 |
| fi | 8 | 6 | 2 | 2 | 2 | 6 |
Statistics Solution:-
Let us make the table of the given data and append other columns after calculations.
| Xi | fi | c.f. | |xi – M| | fi |xi – M| |
| 5 | 8 | 8 | 2 | 16 |
| 7 | 6 | 14 | 0 | 0 |
| 9 | 2 | 16 | 2 | 4 |
| 10 | 2 | 18 | 3 | 6 |
| 12 | 2 | 20 | 5 | 10 |
| 15 | 6 | 26 | 8 | 48 |
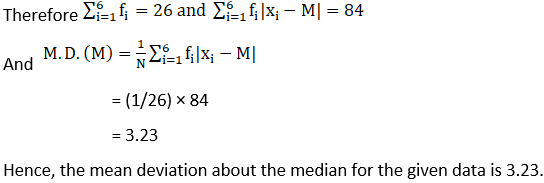
Now, N = 26, which is even.
Median is the mean of the 13th and 14th observations. Both of these observations lie in the cumulative frequency of 14, for which the corresponding observation is 7.
Then,
Median = (13th observation + 14th observation)/2
= (7 + 7)/2
= 14/2
= 7
So, the absolute values of the respective deviations from the median, i.e., |xi – M| are shown in the table.
8.
| xi | 15 | 21 | 27 | 30 | 35 |
| fi | 3 | 5 | 6 | 7 | 8 |
Solution:-
Let us make the table of the given data and append other columns after calculations.
| Xi | fi | c.f. | |xi – M| | fi |xi – M| |
| 15 | 3 | 3 | 15 | 45 |
| 21 | 5 | 8 | 9 | 45 |
| 27 | 6 | 14 | 3 | 18 |
| 30 | 7 | 21 | 0 | 0 |
| 35 | 8 | 29 | 5 | 40 |
Now, N = 29, which is odd.
So, 29/2 = 14.5
The cumulative frequency greater than 14.5 is 21, for which the corresponding observation is 30.
Then,
Median = (15th observation + 16th observation)/2
= (30 + 30)/2
= 60/2
= 30
So, the absolute values of the respective deviations from the median, i.e., |xi – M| are shown in the table.

Find the mean deviation about the mean for the data in Exercises 9 and 10.
9.
| Income per day in ₹ | 0 – 100 | 100 – 200 | 200 – 300 | 300 – 400 | 400 – 500 | 500 – 600 | 600 – 700 | 700 – 800 |
| Number of persons | 4 | 8 | 9 | 10 | 7 | 5 | 4 | 3 |
Solution:-
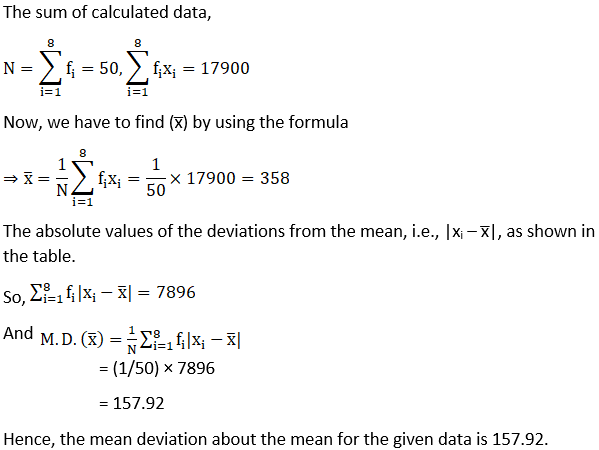
Let us make the table of the given data and append other columns after calculations.
| Income per day in ₹ | Number of persons fi | Midpoints
xi |
fixi | |xi – x̅| | fi|xi – x̅| |
| 0 – 100 | 4 | 50 | 200 | 308 | 1232 |
| 100 – 200 | 8 | 150 | 1200 | 208 | 1664 |
| 200 – 300 | 9 | 250 | 2250 | 108 | 972 |
| 300 – 400 | 10 | 350 | 3500 | 8 | 80 |
| 400 – 500 | 7 | 450 | 3150 | 92 | 644 |
| 500 – 600 | 5 | 550 | 2750 | 192 | 960 |
| 600 – 700 | 4 | 650 | 2600 | 292 | 1160 |
| 700 – 800 | 3 | 750 | 2250 | 392 | 1176 |
| 50 | 17900 | 7896 |
10.
| Height in cms | 95 – 105 | 105 – 115 | 115 – 125 | 125 – 135 | 135 – 145 | 145 – 155 |
| Number of boys | 9 | 13 | 26 | 30 | 12 | 10 |
Solution:-
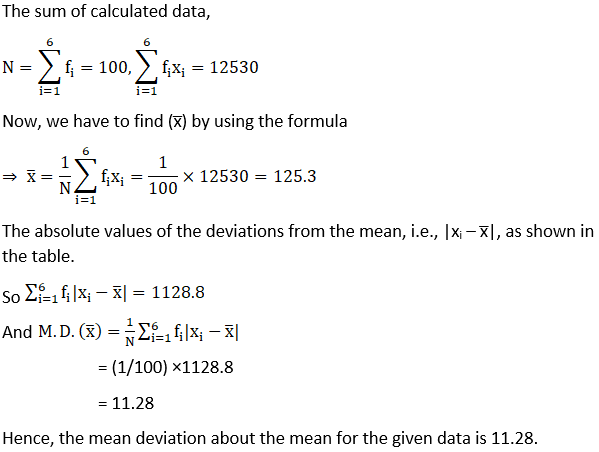
Let us make the table of the given data and append other columns after calculations.
| Height in cms | Number of boys fi | Midpoints
xi |
fixi | |xi – x̅| | fi|xi – x̅| |
| 95 – 105 | 9 | 100 | 900 | 25.3 | 227.7 |
| 105 – 115 | 13 | 110 | 1430 | 15.3 | 198.9 |
| 115 – 125 | 26 | 120 | 3120 | 5.3 | 137.8 |
| 125 – 135 | 30 | 130 | 3900 | 4.7 | 141 |
| 135 – 145 | 12 | 140 | 1680 | 14.7 | 176.4 |
| 145 – 155 | 10 | 150 | 1500 | 24.7 | 247 |
| 100 | 12530 | 1128.8 |
11. Find the mean deviation about median for the following data.
| Marks | 0 -10 | 10 -20 | 20 – 30 | 30 – 40 | 40 – 50 | 50 – 60 |
| Number of girls | 6 | 8 | 14 | 16 | 4 | 2 |
Solution:-
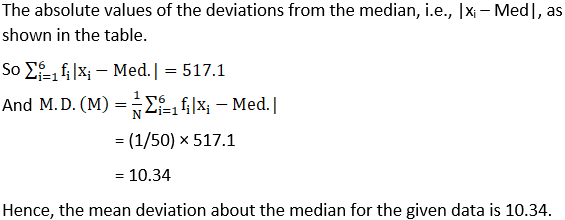
Let us make the table of the given data and append other columns after calculations.
| Marks | Number of girls fi | Cumulative frequency (c.f.) | Mid -points
xi |
|xi – Med| | fi|xi – Med| |
| 0 – 10 | 6 | 6 | 5 | 22.85 | 137.1 |
| 10 – 20 | 8 | 14 | 15 | 12.85 | 102.8 |
| 20 – 30 | 14 | 28 | 25 | 2.85 | 39.9 |
| 30 – 40 | 16 | 44 | 35 | 7.15 | 114.4 |
| 40 – 50 | 4 | 48 | 45 | 17.15 | 68.6 |
| 50 – 60 | 2 | 50 | 55 | 27.15 | 54.3 |
| 50 | 517.1 |
The class interval containing Nth/2 or 25th item is 20-30.
So, 20-30 is the median class.
Then,
Median = l + (((N/2) – c)/f) × h
Where, l = 20, c = 14, f = 14, h = 10 and n = 50
Median = 20 + (((25 – 14))/14) × 10
= 20 + 7.85
= 27.85
12. Calculate the mean deviation about median age for the age distribution of 100 persons given below.
| Age
(in years) |
16 – 20 | 21 – 25 | 26 – 30 | 31 – 35 | 36 – 40 | 41 – 45 | 46 – 50 | 51 – 55 |
| Number | 5 | 6 | 12 | 14 | 26 | 12 | 16 | 9 |
[Hint: Convert the given data into continuous frequency distribution by subtracting 0.5 from the lower limit and adding 0.5 to the upper limit of each class interval]
Solution:-
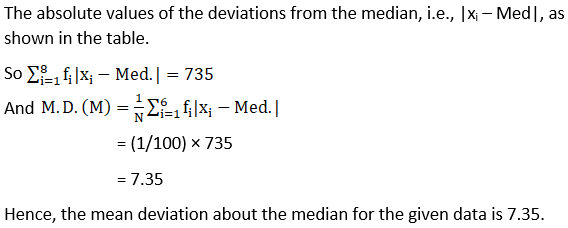
The given data is converted into continuous frequency distribution by subtracting 0.5 from the lower limit and adding the 0.5 to the upper limit of each class intervals and append other columns after calculations.
| Age | Number fi | Cumulative frequency (c.f.) | Midpoints
xi |
|xi – Med| | fi|xi – Med| |
| 15.5 – 20.5 | 5 | 5 | 18 | 20 | 100 |
| 20.5 – 25.5 | 6 | 11 | 23 | 15 | 90 |
| 25.5 – 30.5 | 12 | 23 | 28 | 10 | 120 |
| 30.5 – 35.5 | 14 | 37 | 33 | 5 | 70 |
| 35.5 – 40.5 | 26 | 63 | 38 | 0 | 0 |
| 40.5 – 45.5 | 12 | 75 | 43 | 5 | 60 |
| 45.5 – 50.5 | 16 | 91 | 48 | 10 | 160 |
| 50.5 – 55.5 | 9 | 100 | 53 | 15 | 135 |
| 100 | 735 |
The class interval containing Nth/2 or 50th item is 35.5 – 40.5
So, 35.5 – 40.5 is the median class.
Then,
Median = l + (((N/2) – c)/f) × h
Where, l = 35.5, c = 37, f = 26, h = 5 and N = 100
Median = 35.5 + (((50 – 37))/26) × 5
= 35.5 + 2.5
= 38
NCERT Solutions for Class 11 Maths Chapter 13 Statistics Exercise 13.2 Statistics Class 11
Find the mean and variance for each of the data in Exercise 1 to 5.
1. 6, 7, 10, 12, 13, 4, 8, 12
Solution:-
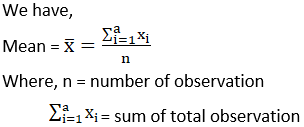
So, x̅ = (6 + 7 + 10 + 12 + 13 + 4 + 8 + 12)/8
= 72/8
= 9
Let us make the table of the given data and append other columns after calculations.
| Xi | Deviations from mean
(xi – x̅) |
(xi – x̅)2 |
| 6 | 6 – 9 = -3 | 9 |
| 7 | 7 – 9 = -2 | 4 |
| 10 | 10 – 9 = 1 | 1 |
| 12 | 12 – 9 = 3 | 9 |
| 13 | 13 – 9 = 4 | 16 |
| 4 | 4 – 9 = – 5 | 25 |
| 8 | 8 – 9 = – 1 | 1 |
| 12 | 12 – 9 = 3 | 9 |
| 74 |
We know that the Variance,
σ2 = (1/8) × 74
= 9.2
∴Mean = 9 and Variance = 9.25
2. First n natural numbers
Solution:-
We know that Mean = Sum of all observations/Number of observations
∴Mean, x̅ = ((n(n + 1))2)/n
= (n + 1)/2
and also, WKT Variance,
By substituting the value of x̅, we get
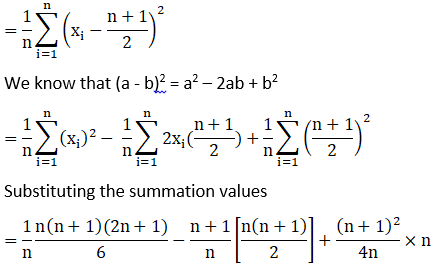
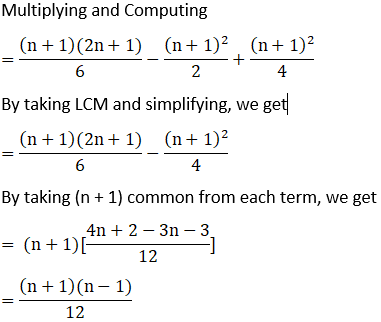
WKT, (a + b)(a – b) = a2 – b2
σ2 = (n2 – 1)/12
∴Mean = (n + 1)/2 and Variance = (n2 – 1)/12
3. First 10 multiples of 3
Solution:-
First, we have to write the first 10 multiples of 3.
3, 6, 9, 12, 15, 18, 21, 24, 27, 30
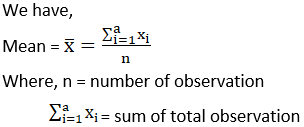
So, x̅ = (3 + 6 + 9 + 12 + 15 + 18 + 21 + 24 + 27 + 30)/10
= 165/10
= 16.5
Let us make the table of the data and append other columns after calculations.
| Xi | Deviations from mean
(xi – x̅) |
(xi – x̅)2 |
| 3 | 3 – 16.5 = -13.5 | 182.25 |
| 6 | 6 – 16.5 = -10.5 | 110.25 |
| 9 | 9 – 16.5 = -7.5 | 56.25 |
| 12 | 12 – 16.5 = -4.5 | 20.25 |
| 15 | 15 – 16.5 = -1.5 | 2.25 |
| 18 | 18 – 16.5 = 1.5 | 2.25 |
| 21 | 21 – 16.5 = – 4.5 | 20.25 |
| 24 | 24 – 16.5 = 7.5 | 56.25 |
| 27 | 27 – 16.5 = 10.5 | 110.25 |
| 30 | 30 – 16.5 = 13.5 | 182.25 |
| 742.5 |
Then, the Variance
= (1/10) × 742.5
= 74.25
∴Mean = 16.5 and Variance = 74.25
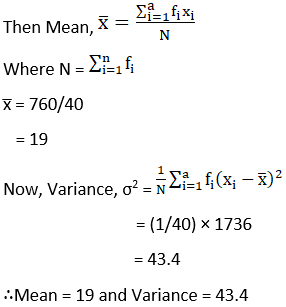
4.
| xi | 6 | 10 | 14 | 18 | 24 | 28 | 30 |
| fi | 2 | 4 | 7 | 12 | 8 | 4 | 3 |
Solution:-
Let us make the table of the given data and append other columns after calculations.
| Xi | fi | fixi | Deviations from mean
(xi – x̅) |
(xi – x̅)2 | fi(xi – x̅)2 |
| 6 | 2 | 12 | 6 – 19 = 13 | 169 | 338 |
| 10 | 4 | 40 | 10 – 19 = -9 | 81 | 324 |
| 14 | 7 | 98 | 14 – 19 = -5 | 25 | 175 |
| 18 | 12 | 216 | 18 – 19 = -1 | 1 | 12 |
| 24 | 8 | 192 | 24 – 19 = 5 | 25 | 200 |
| 28 | 4 | 112 | 28 – 19 = 9 | 81 | 324 |
| 30 | 3 | 90 | 30 – 19 = 11 | 121 | 363 |
| N = 40 | 760 | 1736 |
5.
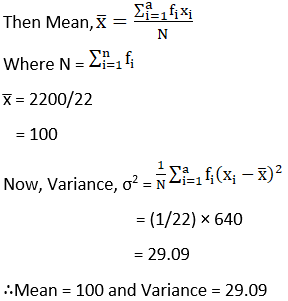
| xi | 92 | 93 | 97 | 98 | 102 | 104 | 109 |
| fi | 3 | 2 | 3 | 2 | 6 | 3 | 3 |
Solution:-
Let us make the table of the given data and append other columns after calculations.
| Xi | fi | fixi | Deviations from mean
(xi – x̅) |
(xi – x̅)2 | fi(xi – x̅)2 |
| 92 | 3 | 276 | 92 – 100 = -8 | 64 | 192 |
| 93 | 2 | 186 | 93 – 100 = -7 | 49 | 98 |
| 97 | 3 | 291 | 97 – 100 = -3 | 9 | 27 |
| 98 | 2 | 196 | 98 – 100 = -2 | 4 | 8 |
| 102 | 6 | 612 | 102 – 100 = 2 | 4 | 24 |
| 104 | 3 | 312 | 104 – 100 = 4 | 16 | 48 |
| 109 | 3 | 327 | 109 – 100 = 9 | 81 | 243 |
| N = 22 | 2200 | 640 |
6. Find the mean and standard deviation using short-cut method.
| xi | 60 | 61 | 62 | 63 | 64 | 65 | 66 | 67 | 68 |
| fi | 2 | 1 | 12 | 29 | 25 | 12 | 10 | 4 | 5 |
Solution:-
Let the assumed mean A = 64. Here, h = 1
We obtain the following table from the given data.
| Xi | Frequency fi | Yi = (xi – A)/h | Yi2 | fiyi | fiyi2 |
| 60 | 2 | -4 | 16 | -8 | 32 |
| 61 | 1 | -3 | 9 | -3 | 9 |
| 62 | 12 | -2 | 4 | -24 | 48 |
| 63 | 29 | -1 | 1 | -29 | 29 |
| 64 | 25 | 0 | 0 | 0 | 0 |
| 65 | 12 | 1 | 1 | 12 | 12 |
| 66 | 10 | 2 | 4 | 20 | 40 |
| 67 | 4 | 3 | 9 | 12 | 36 |
| 68 | 5 | 4 | 16 | 20 | 80 |
| 0 | 286 |
Mean,
Where A = 64, h = 1
So, x̅ = 64 + ((0/100) × 1)
= 64 + 0
= 64
Then, the variance,
![]()
σ2 = (12/1002) [100(286) – 02]
= (1/10000) [28600 – 0]
= 28600/10000
= 2.86
Hence, standard deviation = σ = √2.886
= 1.691
∴ Mean = 64 and Standard Deviation = 1.691
Find the mean and variance for the following frequency distributions in Exercises 7 and 8.
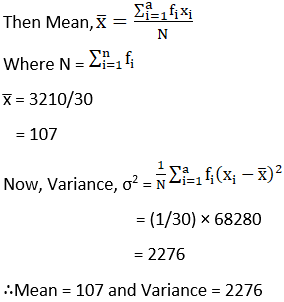
7.
| Classes | 0 – 30 | 30 – 60 | 60 – 90 | 90 – 120 | 120 – 150 | 150 – 180 | 180 – 210 |
| Frequencies | 2 | 3 | 5 | 10 | 3 | 5 | 2 |
Solution:-
Let us make the table of the given data and append other columns after calculations.
| Classes | Frequency fi | Midpoints
xi |
fixi | (xi – x̅) | (xi – x̅)2 | fi(xi – x̅)2 |
| 0 – 30 | 2 | 15 | 30 | -92 | 8464 | 16928 |
| 30 – 60 | 3 | 45 | 135 | -62 | 3844 | 11532 |
| 60 – 90 | 5 | 75 | 375 | -32 | 1024 | 5120 |
| 90 – 120 | 10 | 105 | 1050 | -2 | 4 | 40 |
| 120 – 150 | 3 | 135 | 405 | 28 | 784 | 2352 |
| 150 – 180 | 5 | 165 | 825 | 58 | 3364 | 16820 |
| 180 – 210 | 2 | 195 | 390 | 88 | 7744 | 15488 |
| N = 30 | 3210 | 68280 |
8.
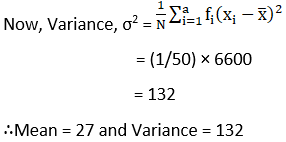
| Classes | 0 – 10 | 10 – 20 | 20 – 30 | 30 – 40 | 40 –50 |
| Frequencies | 5 | 8 | 15 | 16 | 6 |
Solution:-
Let us make the table of the given data and append other columns after calculations.
| Classes | Frequency fi | Midpoints
xi |
fixi | (xi – x̅) | (xi – x̅)2 | fi(xi – x̅)2 |
| 0 – 10 | 5 | 5 | 25 | -22 | 484 | 2420 |
| 10 – 20 | 8 | 15 | 120 | -12 | 144 | 1152 |
| 20 – 30 | 15 | 25 | 375 | -2 | 4 | 60 |
| 30 – 40 | 16 | 35 | 560 | 8 | 64 | 1024 |
| 40 –50 | 6 | 45 | 270 | 18 | 324 | 1944 |
| N = 50 | 1350 | 6600 |
9. Find the mean, variance and standard deviation using the short-cut method.
| Height in cms | 70 – 75 | 75 – 80 | 80 – 85 | 85 – 90 | 90 – 95 | 95 – 100 | 100 – 105 | 105 – 110 | 110 – 115 |
| Frequencies | 3 | 4 | 7 | 7 | 15 | 9 | 6 | 6 | 3 |
Solution:-
Let the assumed mean, A = 92.5 and h = 5
Let us make the table of the given data and append other columns after calculations.
| Height (class) | Number of children
Frequency fi |
Midpoint
Xi |
Yi = (xi – A)/h | Yi2 | fiyi | fiyi2 |
| 70 – 75 | 3 | 72.5 | -4 | 16 | -12 | 48 |
| 75 – 80 | 4 | 77.5 | -3 | 9 | -12 | 36 |
| 80 – 85 | 7 | 82.5 | -2 | 4 | -14 | 28 |
| 85 – 90 | 7 | 87.5 | -1 | 1 | -7 | 7 |
| 90 – 95 | 15 | 92.5 | 0 | 0 | 0 | 0 |
| 95 – 100 | 9 | 97.5 | 1 | 1 | 9 | 9 |
| 100 – 105 | 6 | 102.5 | 2 | 4 | 12 | 24 |
| 105 – 110 | 6 | 107.5 | 3 | 9 | 18 | 54 |
| 110 – 115 | 3 | 112.5 | 4 | 16 | 12 | 48 |
| N = 60 | 6 | 254 |
Mean,
Where, A = 92.5, h = 5
So, x̅ = 92.5 + ((6/60) × 5)
= 92.5 + ½
= 92.5 + 0.5
= 93
Then, the Variance,
![]()
σ2 = (52/602) [60(254) – 62]
= (1/144) [15240 – 36]
= 15204/144
= 1267/12
= 105.583
Hence, standard deviation = σ = √105.583
= 10.275
∴ Mean = 93, variance = 105.583 and Standard Deviation = 10.275
10. The diameters of circles (in mm) drawn in a design are given below.
| Diameters | 33 – 36 | 37 – 40 | 41 – 44 | 45 – 48 | 49 – 52 |
| No. of circles | 15 | 17 | 21 | 22 | 25 |
Calculate the standard deviation and mean diameter of the circles.
[Hint: First, make the data continuous by making the classes as 32.5-36.5, 36.5-40.5, 40.5-44.5, 44.5 – 48.5, 48.5 – 52.5 and then proceed.]
Solution:-
Let the assumed mean, A = 42.5 and h = 4
Let us make the table of the given data and append other columns after calculations.
| Height (class) | Number of children
(Frequency fi) |
Midpoint
Xi |
Yi = (xi – A)/h | Yi2 | fiyi | fiyi2 |
| 32.5 – 36.5 | 15 | 34.5 | -2 | 4 | -30 | 60 |
| 36.5 – 40.5 | 17 | 38.5 | -1 | 1 | -17 | 17 |
| 40.5 – 44.5 | 21 | 42.5 | 0 | 0 | 0 | 0 |
| 44.5 – 48.5 | 22 | 46.5 | 1 | 1 | 22 | 22 |
| 48.5 – 52.5 | 25 | 50.5 | 2 | 4 | 50 | 100 |
| N = 100 | 25 | 199 |
Mean,
Where, A = 42.5, h = 4
So, x̅ = 42.5 + (25/100) × 4
= 42.5 + 1
= 43.5
Then, the Variance,
![]()
σ2 = (42/1002)[100(199) – 252]
= (1/625) [19900 – 625]
= 19275/625
= 771/25
= 30.84
Hence, standard deviation = σ = √30.84
= 5.553
∴ Mean = 43.5, variance = 30.84 and Standard Deviation = 5.553.
NCERT Solutions for Class 11 Maths Chapter 13 Statistics Exercise 13.3 Statistics Class 11
1. From the data given below state which group is more variable, A or B?
| Marks | 10 – 20 | 20 – 30 | 30 – 40 | 40 – 50 | 50 – 60 | 60 – 70 | 70 – 80 |
| Group A | 9 | 17 | 32 | 33 | 40 | 10 | 9 |
| Group B | 10 | 20 | 30 | 25 | 43 | 15 | 7 |
Solution:-
For comparing the variability or dispersion of two series, we calculate the coefficient of variance for each series. The series having greater C.V. is said to be more variable than the other. The series having lesser C.V. is said to be more consistent than the other.
Co-efficient of variation (C.V.) = (σ/ x̅) × 100
Where, σ = standard deviation, x̅ = mean
For Group A.
| Marks | Group A
fi |
Midpoint
Xi |
Yi = (xi – A)/h | (Yi)2 | fiyi | fi(yi)2 |
| 10 – 20 | 9 | 15 | ((15 – 45)/10) = -3 | (-3)2
= 9 |
– 27 | 81 |
| 20 – 30 | 17 | 25 | ((25 – 45)/10) = -2 | (-2)2
= 4 |
– 34 | 68 |
| 30 – 40 | 32 | 35 | ((35 – 45)/10) = – 1 | (-1)2
= 1 |
– 32 | 32 |
| 40 – 50 | 33 | 45 | ((45 – 45)/10) = 0 | 02 | 0 | 0 |
| 50 – 60 | 40 | 55 | ((55 – 45)/10) = 1 | 12
= 1 |
40 | 40 |
| 60 – 70 | 10 | 65 | ((65 – 45)/10) = 2 | 22
= 4 |
20 | 40 |
| 70 – 80 | 9 | 75 | ((75 – 45)/10) = 3 | 32
= 9 |
27 | 81 |
| Total | 150 | -6 | 342 |
![]()
Where A = 45,
and yi = (xi – A)/h
Here h = class size = 20 – 10
h = 10
So, x̅ = 45 + ((-6/150) × 10)
= 45 – 0.4
= 44.6
![]()
σ2 = (102/1502) [150(342) – (-6)2]
= (100/22500) [51,300 – 36]
= (100/22500) × 51264
= 227.84
Hence, standard deviation = σ = √227.84
= 15.09
∴ C.V for group A = (σ/ x̅) × 100
= (15.09/44.6) × 100
= 33.83
Now, for group B.
| Marks | Group B
fi |
Midpoint
Xi |
Yi = (xi – A)/h | (Yi)2 | fiyi | fi(yi)2 |
| 10 – 20 | 10 | 15 | ((15 – 45)/10) = -3 | (-3)2
= 9 |
– 30 | 90 |
| 20 – 30 | 20 | 25 | ((25 – 45)/10) = -2 | (-2)2
= 4 |
– 40 | 80 |
| 30 – 40 | 30 | 35 | ((35 – 45)/10) = – 1 | (-1)2
= 1 |
– 30 | 30 |
| 40 – 50 | 25 | 45 | ((45 – 45)/10) = 0 | 02 | 0 | 0 |
| 50 – 60 | 43 | 55 | ((55 – 45)/10) = 1 | 12
= 1 |
43 | 43 |
| 60 – 70 | 15 | 65 | ((65 – 45)/10) = 2 | 22
= 4 |
30 | 60 |
| 70 – 80 | 7 | 75 | ((75 – 45)/10) = 3 | 32
= 9 |
21 | 63 |
| Total | 150 | -6 | 366 |
![]()
Where A = 45,
h = 10
So, x̅ = 45 + ((-6/150) × 10)
= 45 – 0.4
= 44.6
![]()
σ2 = (102/1502) [150(366) – (-6)2]
= (100/22500) [54,900 – 36]
= (100/22500) × 54,864
= 243.84
Hence, standard deviation = σ = √243.84
= 15.61
∴ C.V for group B = (σ/ x̅) × 100
= (15.61/44.6) × 100
= 35
By comparing the C.V. of group A and group B.
C.V of Group B > C.V. of Group A
So, Group B is more variable.
2. From the prices of shares X and Y below, find out which is more stable in value.
| X | 35 | 54 | 52 | 53 | 56 | 58 | 52 | 50 | 51 | 49 |
| Y | 108 | 107 | 105 | 105 | 106 | 107 | 104 | 103 | 104 | 101 |
Solution:-
From the given data,
Let us make the table of the given data and append other columns after calculations.
| X (xi) | Y (yi) | Xi2 | Yi2 |
| 35 | 108 | 1225 | 11664 |
| 54 | 107 | 2916 | 11449 |
| 52 | 105 | 2704 | 11025 |
| 53 | 105 | 2809 | 11025 |
| 56 | 106 | 8136 | 11236 |
| 58 | 107 | 3364 | 11449 |
| 52 | 104 | 2704 | 10816 |
| 50 | 103 | 2500 | 10609 |
| 51 | 104 | 2601 | 10816 |
| 49 | 101 | 2401 | 10201 |
| Total = 510 | 1050 | 26360 | 110290 |
We have to calculate Mean for x,
Mean x̅ = ∑xi/n
Where, n = number of terms
= 510/10
= 51
Then, Variance for x =
= (1/102)[(10 × 26360) – 5102]
= (1/100) (263600 – 260100)
= 3500/100
= 35
WKT Standard deviation = √variance
= √35
= 5.91
So, co-efficient of variation = (σ/ x̅) × 100
= (5.91/51) × 100
= 11.58
Now, we have to calculate Mean for y,
Mean ȳ = ∑yi/n
Where, n = number of terms
= 1050/10
= 105
Then, Variance for y =
= (1/102)[(10 × 110290) – 10502]
= (1/100) (1102900 – 1102500)
= 400/100
= 4
WKT Standard deviation = √variance
= √4
= 2
So, co-efficient of variation = (σ/ x̅) × 100
= (2/105) × 100
= 1.904
By comparing C.V. of X and Y,
C.V of X > C.V. of Y
So, Y is more stable than X.
3. An analysis of monthly wages paid to workers in two firms, A and B, belonging to the same industry, gives the following results:
| Firm A | Firm B | |
| No. of wages earners | 586 | 648 |
| Mean of monthly wages | Rs 5253 | Rs 5253 |
| Variance of the distribution of wages | 100 | 121 |
(i) Which firm, A or B, pays a larger amount as monthly wages?
(ii) Which firm, A or B, shows greater variability in individual wages?
Solution:-
(i) From the given table,
Mean monthly wages of firm A = Rs 5253
and Number of wage earners = 586
Then,
Total amount paid = 586 × 5253
= Rs 3078258
Mean monthly wages of firm B = Rs 5253
Number of wage earners = 648
Then,
Total amount paid = 648 × 5253
= Rs 34,03,944
So, firm B pays larger amount as monthly wages.
(ii) Variance of firm A = 100
We know that, standard deviation (σ)= √100
=10
Variance of firm B = 121
Then,
Standard deviation (σ)=√(121 )
=11
Hence, the standard deviation is more in case of Firm B. That means, in firm B, there is greater variability in individual wages.
4. The following is the record of goals scored by team A in a football session:
| No. of goals scored | 0 | 1 | 2 | 3 | 4 |
| No. of matches | 1 | 9 | 7 | 5 | 3 |
For team B, the mean number of goals scored per match was 2, with a standard deviation 1.25 goals. Find which team may be considered more consistent?
Solution:-
From the given data,
Let us make the table of the given data and append other columns after calculations.
| Number of goals scored xi | Number of matches fi | fixi | Xi2 | fixi2 |
| 0 | 1 | 0 | 0 | 0 |
| 1 | 9 | 9 | 1 | 9 |
| 2 | 7 | 14 | 4 | 28 |
| 3 | 5 | 15 | 9 | 45 |
| 4 | 3 | 12 | 16 | 48 |
| Total | 25 | 50 | 130 |
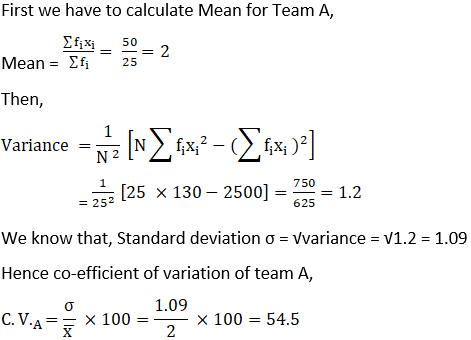
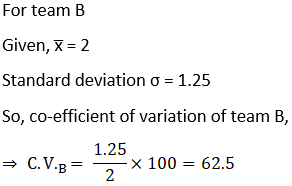
C.V. of firm B is greater.
∴ Team A is more consistent.
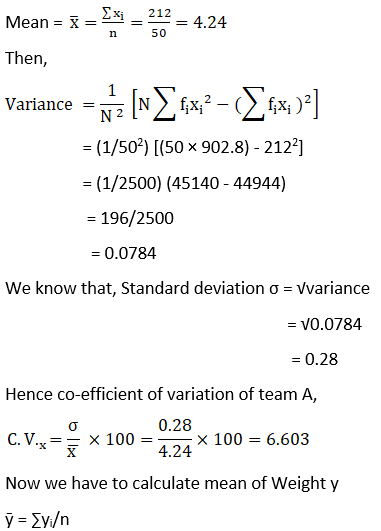
5. The sum and sum of squares corresponding to length x (in cm) and weight y (in gm) of 50 plant products are given below:

Which is more varying, the length or weight?
Solution:-
First, we have to calculate Mean for Length x.
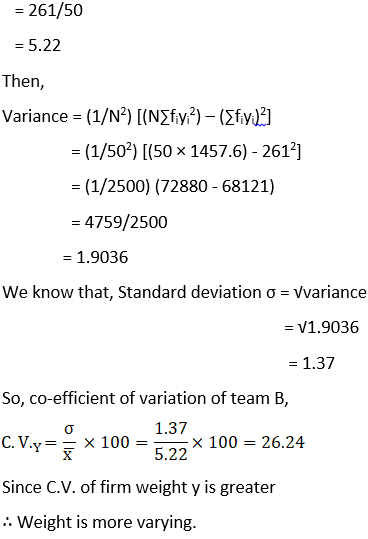
NCERT Solutions for Class 11 Maths Chapter 13 Statistics Exercise Statistics Class 11
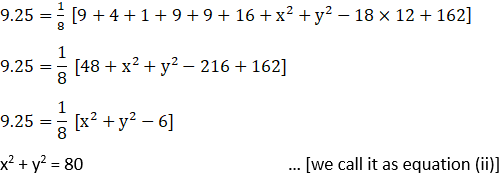
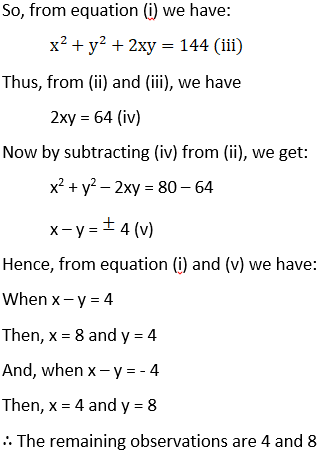
1. The mean and variance of eight observations are 9 and 9.25, respectively. If six of the observations are 6, 7, 10, 12, 12 and 13, find the remaining two observations.
Solution:-
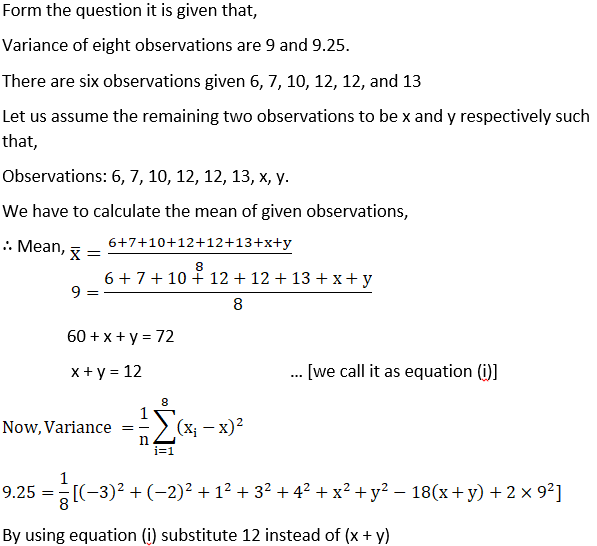
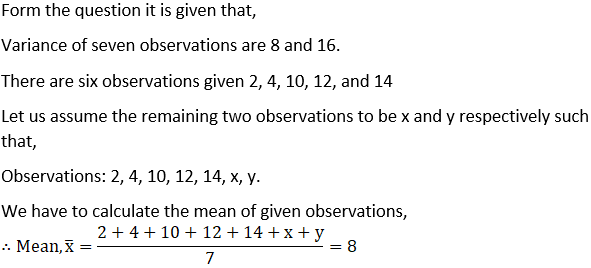
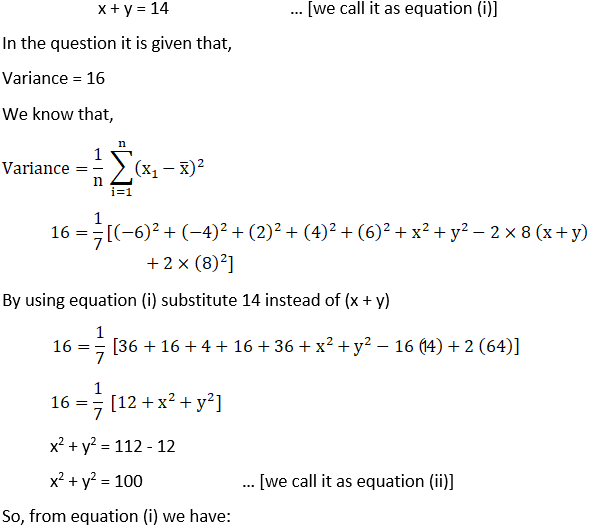
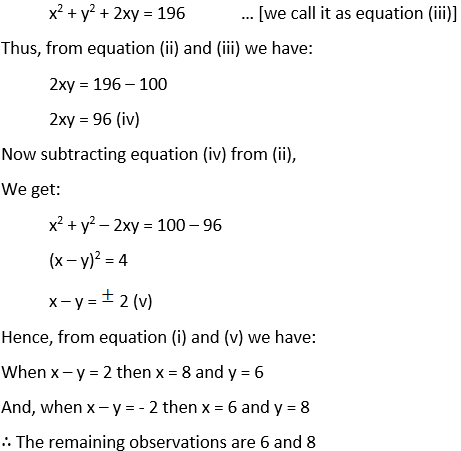
2. The mean and variance of 7 observations are 8 and 16, respectively. If five of the observations are 2, 4, 10, 12, 14. Find the remaining two observations.
Solution:-
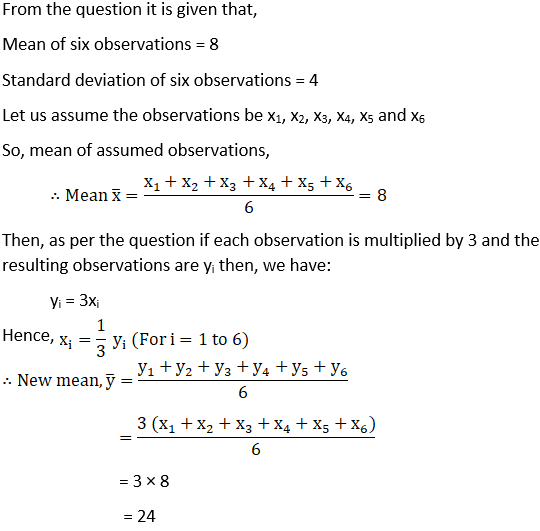
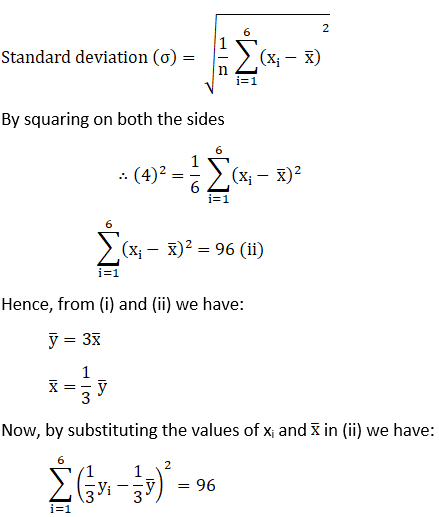
3. The mean and standard deviation of six observations are 8 and 4, respectively. If each observation is multiplied by 3, find the new mean and new standard deviation of the resulting observations.
Solution:-
We know that,
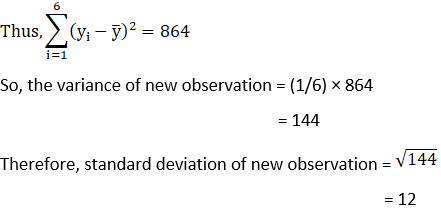
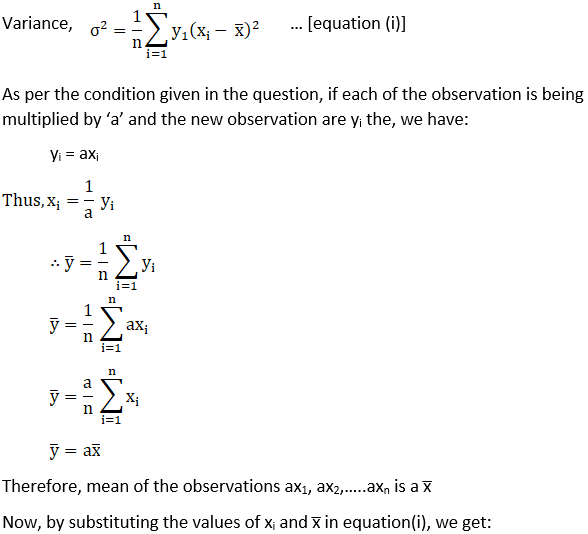
4. Given that x̅ is the mean and σ2 is the variance of n observations x1, x2, …,xn . Prove that the mean and variance of the observations ax1, ax2, ax3, …., axn are ax̅ and a2σ2, respectively, (a ≠ 0).
Solution:-
From the question, it is given that, n observations are x1, x2,…..xn
Mean of the n observation = x̅
Variance of the n observation = σ2
As we know,
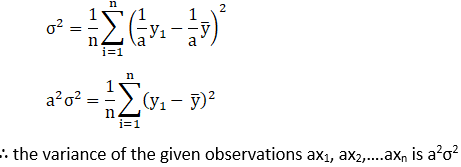
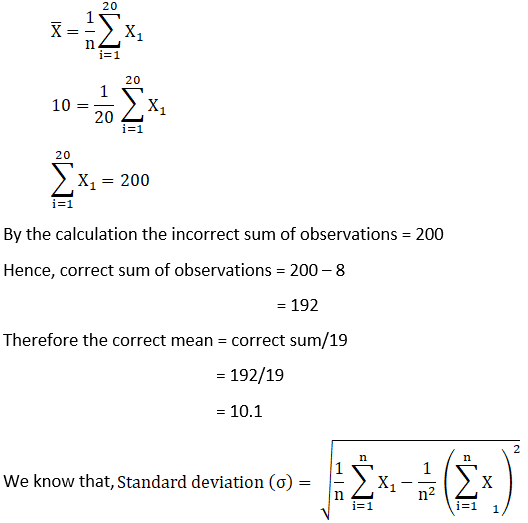
5. The mean and standard deviation of 20 observations are found to be 10 and 2, respectively. On rechecking, it was found that an observation 8 was incorrect. Calculate the correct mean and standard deviation in each of the following cases: (i) If wrong item is omitted. (ii) If it is replaced by 12
Solution:-
(i) If the wrong item is omitted,
From the question, it is given that
The number of observations, i.e., n = 20
The incorrect mean = 20
The incorrect standard deviation = 2
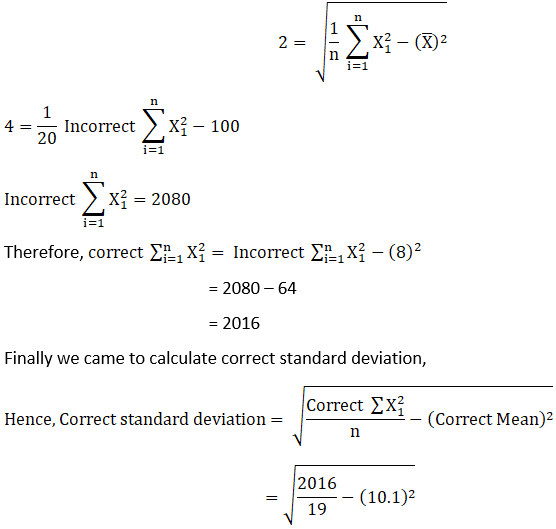

(ii) If it is replaced by 12,
From the question, it is given that
The number of incorrect sum observations, i.e., n = 200
The correct sum of observations n = 200 – 8 + 12
n = 204
Then, correct mean = correct sum/20
= 204/20
= 10.2
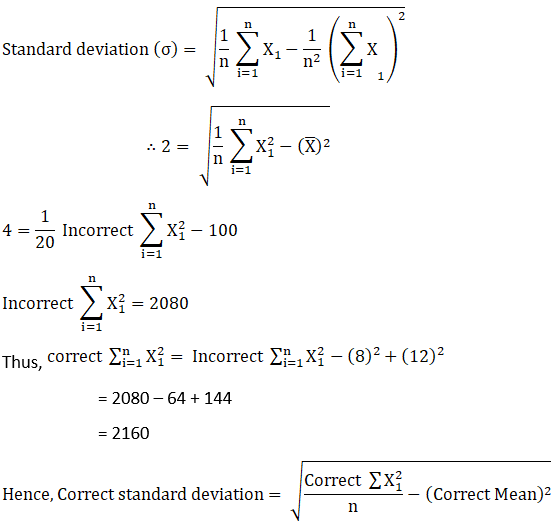
6. The mean and standard deviation of marks obtained by 50 students of a class in three subjects, Mathematics, Physics and Chemistry, are given below.
| Subject | Mathematics | Physics | Chemistry |
| Mean | 42 | 32 | 40.9 |
| Standard deviation | 12 | 15 | 20 |
Which of the three subjects shows the highest variability in marks, and which shows the lowest?
Solution:-
From the question, it is given that
Mean of Mathematics = 42
Standard deviation of Mathematics = 12
Mean of Physics = 32
Standard deviation of physics = 15
Mean of Chemistry = 40.9
Standard deviation of chemistry = 20
As we know,
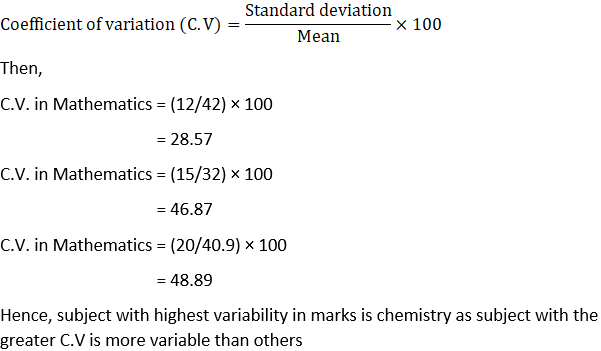
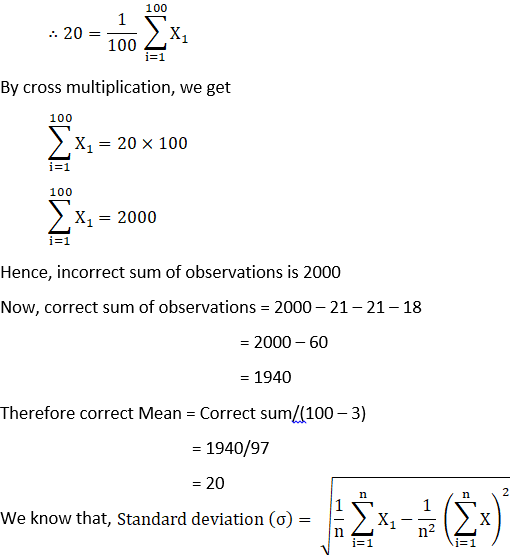
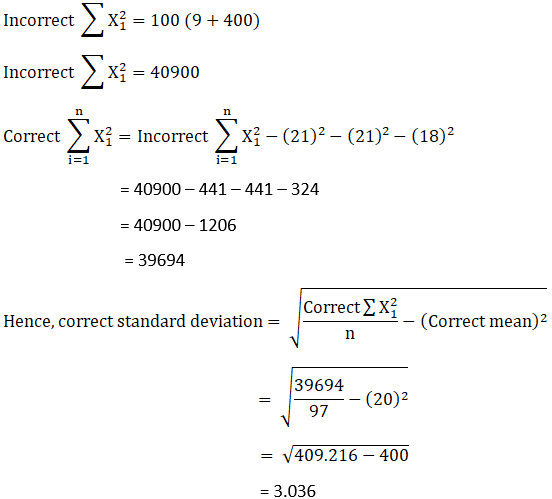
7. The mean and standard deviation of a group of 100 observations were found to be 20 and 3, respectively. Later on, it was found that three observations were incorrect, which were recorded as 21, 21 and 18. Find the mean and standard deviation if the incorrect observations are omitted.
Solution:-
From the question, it is given that
The total number of observations (n) = 100
Incorrect mean, (x̅) = 20
And, Incorrect standard deviation (σ) = 3

latest video
news via inbox
Nulla turp dis cursus. Integer liberos euismod pretium faucibua


